SurfSeis MASW Software
Welcome to the Birthplace of MASW
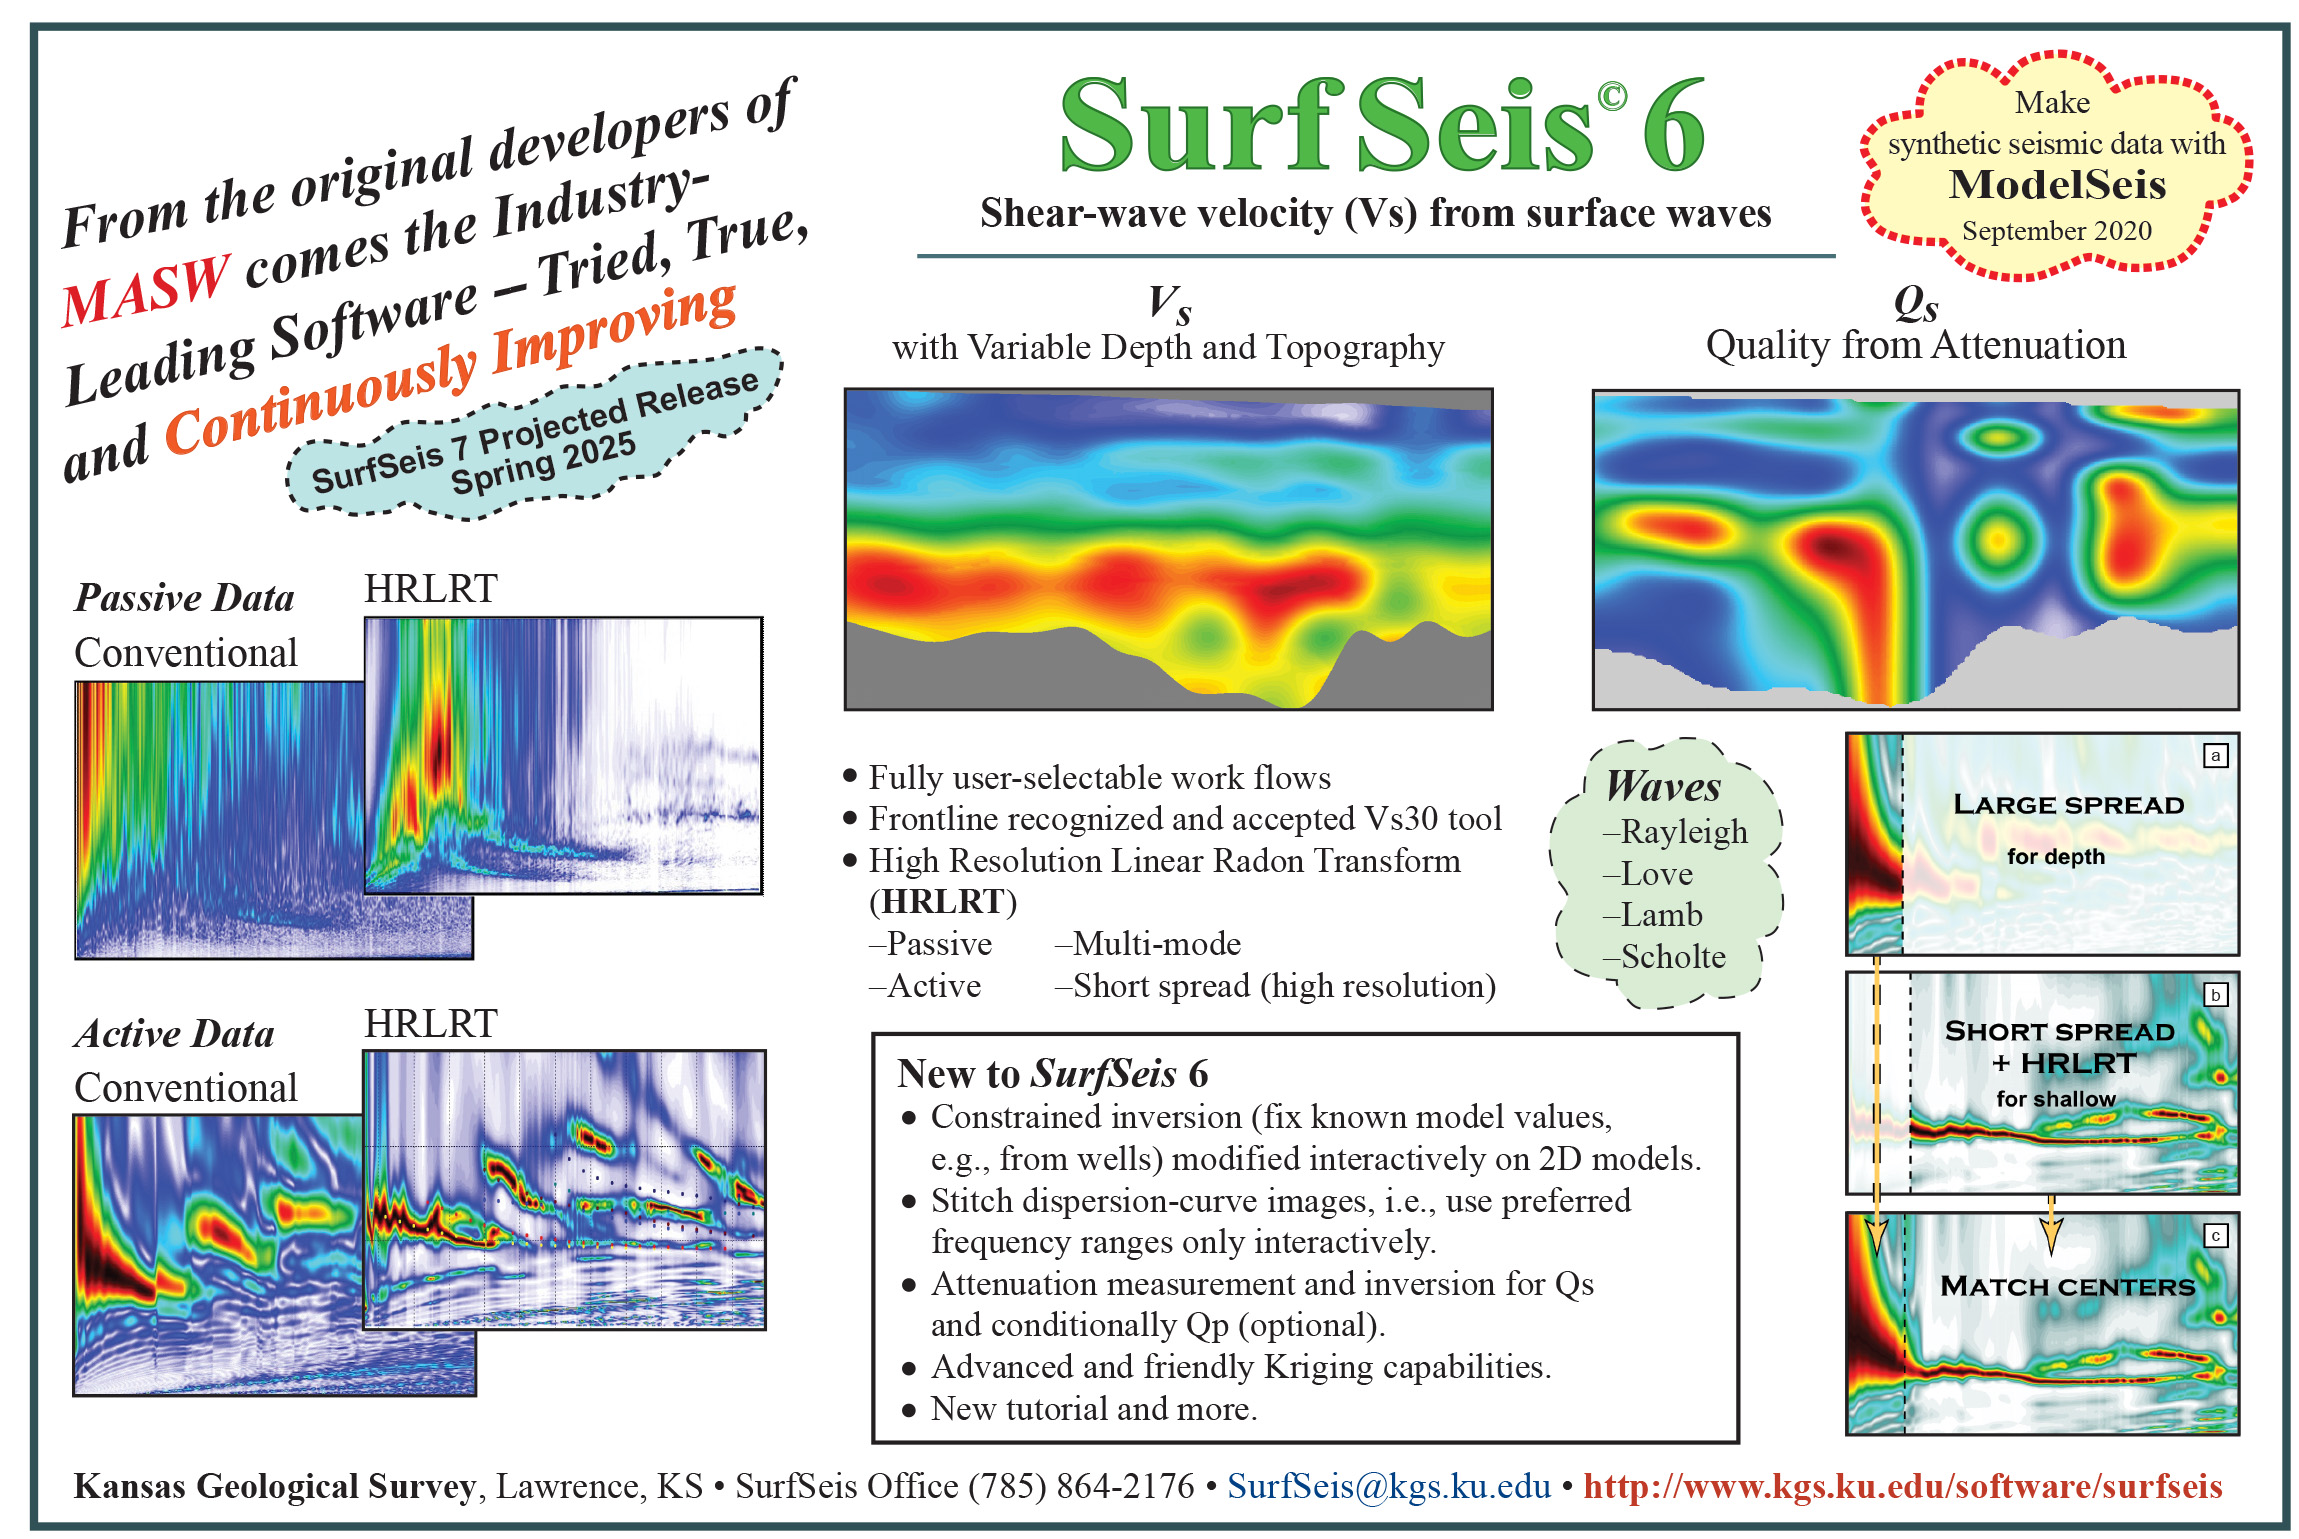
SurfSeis© software was developed at the Kansas Geological Survey to process seismic data using the multichannel analysis of surface waves (MASW) method. Obtain shear-wave velocity (Vs) with depth (z) estimates using SurfSeis.
Surface waves have historically been the bane of near-surface reflection seismologists. With the development of MASW at the KGS has come an explosion in research and use of the MASW method for application to engineering, groundwater, and environmental problems. Scientists from around the world have shown the utility of surface waves as signal rather than noise.
Workshops
We offer a 20-hour (four hours a day for five days) SurfSeis/MASW workshop for anyone interested in learning about the MASW technique or our SurfSeis software. There is no registration fee for workshops. Workshops are scheduled based on interest and instructor availability.
A Virtual workshop (via Zoom) has been scheduled on the following date:
April 20-24, 2026, 9:00 am-12:45 pm CDT (Central Daylight Time, GMT -5 targeting Americas, Europe and Middle East) Full
We're planning our next round of workshops for 2026. Let us know your preferred time by taking this brief survey - we look forward to hearing your thoughts!
Additional Info
- Workshops tend to fill quickly, so register early.
- Small workshop size, e.g., 10-12 for in-house, 18-20 for online.
- To attend an online workshop, you need to have SurfSeis 6
- To attend an in-house workshop you do not need to have SurfSeis 6./li>
- If the current workshop is full, let us know to include you in our next workshop.
Send an email to kgs-exploration@ku.edu to request the workshop information email and a registration form. If there is more than one workshop available, please state the date of your preferred workshop. If there is no workshop currently available, you will be notified via email when the next workshop is scheduled.
Windows 8 and 10
If you're having issues with Windows 8 and 10 and the HASP drivers (which control the HASP dongle), please visit our FAQ for help in installing the latest drivers.
SurfSeis has many unique features, which we have developed exclusively here at the KGS (origin of MASW) since the late 90s to meet our applied research needs and that address real-world problems.
Many of these features were specifically developed to meet the real-world needs of our many collaborators and software partners (we consider every owner of SurfSeis to be a partner). Accuracy of results and therefore information about the subsurface at various sites has always been our primary goal. SurfSeis is a mature software (first copyrighted in 1998), whose science, algorithms, and software applications have been tested for more than decade and a half and verified through both invasive confirmation and the peer review community. There is little doubt that this is the most scientifically sound and up-to-date software available anywhere at this time.
We are also very aware and actually excited that many commercial software developers have recently begun working (last 5 years) to produce software with the same flexibility, thoroughness, accuracy, and completeness as SurfSeis. Competition only benefits the users and the user has always been our focus as we make this living and growing product of our research available to everyone.
We encourage commercial software developers to try to match our science, algorithm efficiencies, breadth of applications, user centric features, etc. Our job and passion is research, but we are striving to make this products of that research available as quickly as possible to everyone through SurfSeis. You can track our most recent publications and match those to features available in SurfSeis (see our flyers on the SurfSeis home page). These comparisons and scientific endorsement through the peer reviewed publication process will provide you all the confidence necessary to become one of our SurfSeis partners.
Following are some unique features of SurfSeis that we use frequently in our research and explanations of how they can be helpful in many applications you might be engaged in. It is very likely most of these can only be found in SurfSeis.
- HRLRT (i.e., the high-resolution linear radon transform)
- Interpret fundamental mode.
- Suppress spectral leakage. This feature can help interpret surface-wave trends, especially in the presence of other stronger modes.
- Interpret higher modes.
- Improving horizontal resolution by allowing the use of shorter spreads while still being able to follow the dispersion curve trends.
- Improving vertical resolution by using more layer when inverting with higher mode.
- Multi-mode inversion
- Minimize instability.
- Higher vertical resolution by using more layer without instability.
- Increase the investigation depth.
- Variable topography
- Variable depth inversion
- Can be an interpretive tool itself.
- Ability to view and import initial models in 2D
- Help avoid initial-model erroneous assumptions/error, which would not have been detected with the single 1D plots approach.
- Ability to import density values or derive 2D density models from Vp using Gardner's or user-specified equation parameters, i.e., tuned for a specific site.
- Love-wave processing
- No Vp a-priori information necessary for inversion
- Better fundamental mode quality due to reduced likelihood for higher mode.
- Scholte-wave (i.e., underwater MASW) processing
- Taking into account the presence of a water layer at the surface instead of air.
- Qs (aka damping ratio) estimation from Rayleigh-wave attenuation measurements
- Window splitting for improving passive data dispersion-curve imaging
- Stitching dispersion-curve images.
- Allows user visually-controlled incorporation of different wavelengths from different data. Such data can result from using different sources, spread sizes, and/or transforms, which can enhance dispersion-curve frequency ranges, horizontal, and vertical resolution of the final results.
Specific approaches, studies, and applications
The HRLRT has been a powerful tool with some data. On active data it provided high-frequencies of the fundamental mode, when conventional transforms failed to do so because of interferences from higher modes. On some passive data sets it provided dispersion-curve images we would not have guested were possible by looking at their conventional-transform counterparts. In addition, window-splitting can further improve the images, if multi passive sources (such as a freight train) were contributing (Ivanov et al., 2013) to your energy.
The HRLRT has been preferred over conventional algorithms by many researchers (Zeng et al., 2012; Pan et al., 2013; Yin et al., 2016; Ivanov et al., 2017; Li et al., 2017; Zhou et al., 2025). We will not be surprised, if you find the HRLRT very useful for some of your data sets, as well.
HRLRT benefits, including both active- and passive-source data are shown by Ivanov et al. (2017a).
HRLRT, Multi-mode inversion, Love waves, and variable depth example can be found in Ivanov et al. (2017b).
Density trend use instead of constant density values was driven by our Ivanov et al. (2016) research.
Qs estimations from attenuation measurements were driven by our research (Xia et al., 2002; Xia et al., 2012; Ivanov et al., 2014; Feigenbaum et al., 2016). Obtaining Qs can be a challenging problem because there are many variable that can contribute to the problem. We have applied special efforts to make it work, including the use of a special filter and the ability to include 2D Vp and density models. To the best of our knowledge, we believe SurfSeis is the only software offering such a tool.
References
Feigenbaum, D., J. Ivanov, R. Miller, S. Peterie, and S. Morton, 2016, Near-surface Qs estimations using multichannel analysis of surface waves (MASW) and the effect of nonfundamental mode energy on Q estimation: An example from Yuma proving ground, Arizona, SEG Technical Program Expanded Abstracts 2016, 4971-4976.
Ivanov, J., B. Leitner, W. T. Shefchik, T. J. Schwenk, and S. L. Peterie, 2013, Evaluating hazards at salt cavern sites using multichannel analysis of surface waves: The Leading Edge, 32, 289-305. [available online]
Ivanov, J., R. D. Miller, S. L. Peterie, and G. Tsoflias, 2014, Near-surface Qs and Qp estimations from Rayleigh waves using multi-channel analysis of surface waves (MASW) at an Arctic ice-sheet site, SEG Technical Program Expanded Abstracts 2014, 2006-2012. [available online]
Ivanov, J., G. Tsoflias, R. D. Miller, S. Peterie, S. Morton, and J. Xia, 2016, Impact of density information on Rayleigh surface wave inversion results: Journal of Applied Geophysics, 135, 43-54. [available online from Elsevier]
Ivanov, J., R. Miller, D. Feigenbaum, and J. Schwenk, 2017a, Benefits of using the high-resolution linear Radon transform with the multichannel analysis of surface waves method, SEG Technical Program Expanded Abstracts 2017, 2647-2653. [available online]
Ivanov, J., R. D. Miller, D. Feigenbaum, S. L. C. Morton, S. L. Peterie, and J. B. Dunbar, 2017b, Revisiting levees in southern Texas using Love-wave multichannel analysis of surface waves with the high-resolution linear Radon transform: Interpretation, 5, T287-T298. [available online]
Li, J., Z. C. Feng, and G. Schuster, 2017, Wave-equation dispersion inversion: Geophysical Journal International, 208, 1567-1578.
Pan, Y. D., J. H. Xia, and C. Zeng, 2013, Verification of correctness of using real part of complex root as Rayleigh-wave phase velocity with synthetic data: Journal of Applied Geophysics, 88, 94-100.
Xia, J. G., Y. X. Xu, R. D. Miller, and J. Ivanov, 2012, Estimation of near-surface quality factors by constrained inversion of Rayleigh-wave attenuation coefficients: Journal of Applied Geophysics, 82, 137-144.
Xia, J. H., R. D. Miller, C. B. Park, and G. Tian, 2002, Determining Q of near-surface materials from Rayleigh waves: Journal of Applied Geophysics, 51, 121-129.
Yin, X., H. Xu, L. Wang, Y. Hu, C. Shen, and S. Sun, 2016, Improving horizontal resolution of high-frequency surface-wave methods using travel-time tomography: Journal of Applied Geophysics, 126, 42-51.
Zeng, C., J. H. Xia, R. D. Miller, G. P. Tsoflias, and Z. J. Wang, 2012, Numerical investigation of MASW applications in presence of surface topography: Journal of Applied Geophysics, 84, 52-60.
Zhou, X., M. Liu, L. Huang, S. Mu, G. Shu, H. Wang, J. Zhang, W. Su, and S. Huo, 2025, Application of FWI technology for the detection of dam structural anomalies: A case study in Western China: Geophysics, 90, 1-17, https://doi.org/10.1190/geo2024-0930.1.
Available since 2000, SurfSeis is the product of many researchers and programmers at the Kansas Geological Survey (KGS).
The KGS is a research institute, and SurfSeis is a product of our research. Users can find documentation of our annual research advancements on the KGS website and in the published literature, and those new features are added to SurfSeis as they become available.
SurfSeis is a research and client proven software. It has been advancing and improving based on testing and peer-sanctioned advancements for more than 22 years. With KGS's decade-plus history of research and continuous improvement to this living software package, the facts as we know them and a number of researchers, programmers, and users have expressed to us, we are confident SurfSeis is the most advanced software for surface-wave seismic data analysis. We feel that we have no equal in the world from a technical or service perspective.
By purchasing SurfSeis customers support our further research.
For additional information, please check our "SurfSeis Features" Page.
Welcome to the Birthplace of MASW
SurfSeis© software was developed at the Kansas Geological Survey to process seismic data using the multichannel analysis of surface waves (MASW) method. Obtain shear-wave velocity (Vs) with depth (z) estimates using SurfSeis.
Surface waves have historically been the bane of near-surface reflection seismologists. With the development of MASW at the KGS has come an explosion in research and use of the MASW method for application to engineering, groundwater, and environmental problems. Scientists from around the world have shown the utility of surface waves as signal rather than noise.
Workshops
We offer a 20-hour (four hours a day for five days) SurfSeis/MASW workshop for anyone interested in learning about the MASW technique or our SurfSeis software. There is no registration fee for workshops. Workshops are scheduled based on interest and instructor availability.
A Virtual workshop (via Zoom) has been scheduled on the following date:
April 20-24, 2026, 9:00 am-12:45 pm CDT (Central Daylight Time, GMT -5 targeting Americas, Europe and Middle East) Full
We're planning our next round of workshops for 2026. Let us know your preferred time by taking this brief survey - we look forward to hearing your thoughts!
Additional Info
- Workshops tend to fill quickly, so register early.
- Small workshop size, e.g., 10-12 for in-house, 18-20 for online.
- To attend an online workshop, you need to have SurfSeis 6
- To attend an in-house workshop you do not need to have SurfSeis 6./li>
- If the current workshop is full, let us know to include you in our next workshop.
Send an email to kgs-exploration@ku.edu to request the workshop information email and a registration form. If there is more than one workshop available, please state the date of your preferred workshop. If there is no workshop currently available, you will be notified via email when the next workshop is scheduled.
Windows 8 and 10
If you're having issues with Windows 8 and 10 and the HASP drivers (which control the HASP dongle), please visit our FAQ for help in installing the latest drivers.
SurfSeis has many unique features, which we have developed exclusively here at the KGS (origin of MASW) since the late 90s to meet our applied research needs and that address real-world problems.
Many of these features were specifically developed to meet the real-world needs of our many collaborators and software partners (we consider every owner of SurfSeis to be a partner). Accuracy of results and therefore information about the subsurface at various sites has always been our primary goal. SurfSeis is a mature software (first copyrighted in 1998), whose science, algorithms, and software applications have been tested for more than decade and a half and verified through both invasive confirmation and the peer review community. There is little doubt that this is the most scientifically sound and up-to-date software available anywhere at this time.
We are also very aware and actually excited that many commercial software developers have recently begun working (last 5 years) to produce software with the same flexibility, thoroughness, accuracy, and completeness as SurfSeis. Competition only benefits the users and the user has always been our focus as we make this living and growing product of our research available to everyone.
We encourage commercial software developers to try to match our science, algorithm efficiencies, breadth of applications, user centric features, etc. Our job and passion is research, but we are striving to make this products of that research available as quickly as possible to everyone through SurfSeis. You can track our most recent publications and match those to features available in SurfSeis (see our flyers on the SurfSeis home page). These comparisons and scientific endorsement through the peer reviewed publication process will provide you all the confidence necessary to become one of our SurfSeis partners.
Following are some unique features of SurfSeis that we use frequently in our research and explanations of how they can be helpful in many applications you might be engaged in. It is very likely most of these can only be found in SurfSeis.
- HRLRT (i.e., the high-resolution linear radon transform)
- Interpret fundamental mode.
- Suppress spectral leakage. This feature can help interpret surface-wave trends, especially in the presence of other stronger modes.
- Interpret higher modes.
- Improving horizontal resolution by allowing the use of shorter spreads while still being able to follow the dispersion curve trends.
- Improving vertical resolution by using more layer when inverting with higher mode.
- Multi-mode inversion
- Minimize instability.
- Higher vertical resolution by using more layer without instability.
- Increase the investigation depth.
- Variable topography
- Variable depth inversion
- Can be an interpretive tool itself.
- Ability to view and import initial models in 2D
- Help avoid initial-model erroneous assumptions/error, which would not have been detected with the single 1D plots approach.
- Ability to import density values or derive 2D density models from Vp using Gardner's or user-specified equation parameters, i.e., tuned for a specific site.
- Love-wave processing
- No Vp a-priori information necessary for inversion
- Better fundamental mode quality due to reduced likelihood for higher mode.
- Scholte-wave (i.e., underwater MASW) processing
- Taking into account the presence of a water layer at the surface instead of air.
- Qs (aka damping ratio) estimation from Rayleigh-wave attenuation measurements
- Window splitting for improving passive data dispersion-curve imaging
- Stitching dispersion-curve images.
- Allows user visually-controlled incorporation of different wavelengths from different data. Such data can result from using different sources, spread sizes, and/or transforms, which can enhance dispersion-curve frequency ranges, horizontal, and vertical resolution of the final results.
Specific approaches, studies, and applications
The HRLRT has been a powerful tool with some data. On active data it provided high-frequencies of the fundamental mode, when conventional transforms failed to do so because of interferences from higher modes. On some passive data sets it provided dispersion-curve images we would not have guested were possible by looking at their conventional-transform counterparts. In addition, window-splitting can further improve the images, if multi passive sources (such as a freight train) were contributing (Ivanov et al., 2013) to your energy.
The HRLRT has been preferred over conventional algorithms by many researchers (Zeng et al., 2012; Pan et al., 2013; Yin et al., 2016; Ivanov et al., 2017; Li et al., 2017; Zhou et al., 2025). We will not be surprised, if you find the HRLRT very useful for some of your data sets, as well.
HRLRT benefits, including both active- and passive-source data are shown by Ivanov et al. (2017a).
HRLRT, Multi-mode inversion, Love waves, and variable depth example can be found in Ivanov et al. (2017b).
Density trend use instead of constant density values was driven by our Ivanov et al. (2016) research.
Qs estimations from attenuation measurements were driven by our research (Xia et al., 2002; Xia et al., 2012; Ivanov et al., 2014; Feigenbaum et al., 2016). Obtaining Qs can be a challenging problem because there are many variable that can contribute to the problem. We have applied special efforts to make it work, including the use of a special filter and the ability to include 2D Vp and density models. To the best of our knowledge, we believe SurfSeis is the only software offering such a tool.
References
Feigenbaum, D., J. Ivanov, R. Miller, S. Peterie, and S. Morton, 2016, Near-surface Qs estimations using multichannel analysis of surface waves (MASW) and the effect of nonfundamental mode energy on Q estimation: An example from Yuma proving ground, Arizona, SEG Technical Program Expanded Abstracts 2016, 4971-4976.
Ivanov, J., B. Leitner, W. T. Shefchik, T. J. Schwenk, and S. L. Peterie, 2013, Evaluating hazards at salt cavern sites using multichannel analysis of surface waves: The Leading Edge, 32, 289-305. [available online]
Ivanov, J., R. D. Miller, S. L. Peterie, and G. Tsoflias, 2014, Near-surface Qs and Qp estimations from Rayleigh waves using multi-channel analysis of surface waves (MASW) at an Arctic ice-sheet site, SEG Technical Program Expanded Abstracts 2014, 2006-2012. [available online]
Ivanov, J., G. Tsoflias, R. D. Miller, S. Peterie, S. Morton, and J. Xia, 2016, Impact of density information on Rayleigh surface wave inversion results: Journal of Applied Geophysics, 135, 43-54. [available online from Elsevier]
Ivanov, J., R. Miller, D. Feigenbaum, and J. Schwenk, 2017a, Benefits of using the high-resolution linear Radon transform with the multichannel analysis of surface waves method, SEG Technical Program Expanded Abstracts 2017, 2647-2653. [available online]
Ivanov, J., R. D. Miller, D. Feigenbaum, S. L. C. Morton, S. L. Peterie, and J. B. Dunbar, 2017b, Revisiting levees in southern Texas using Love-wave multichannel analysis of surface waves with the high-resolution linear Radon transform: Interpretation, 5, T287-T298. [available online]
Li, J., Z. C. Feng, and G. Schuster, 2017, Wave-equation dispersion inversion: Geophysical Journal International, 208, 1567-1578.
Pan, Y. D., J. H. Xia, and C. Zeng, 2013, Verification of correctness of using real part of complex root as Rayleigh-wave phase velocity with synthetic data: Journal of Applied Geophysics, 88, 94-100.
Xia, J. G., Y. X. Xu, R. D. Miller, and J. Ivanov, 2012, Estimation of near-surface quality factors by constrained inversion of Rayleigh-wave attenuation coefficients: Journal of Applied Geophysics, 82, 137-144.
Xia, J. H., R. D. Miller, C. B. Park, and G. Tian, 2002, Determining Q of near-surface materials from Rayleigh waves: Journal of Applied Geophysics, 51, 121-129.
Yin, X., H. Xu, L. Wang, Y. Hu, C. Shen, and S. Sun, 2016, Improving horizontal resolution of high-frequency surface-wave methods using travel-time tomography: Journal of Applied Geophysics, 126, 42-51.
Zeng, C., J. H. Xia, R. D. Miller, G. P. Tsoflias, and Z. J. Wang, 2012, Numerical investigation of MASW applications in presence of surface topography: Journal of Applied Geophysics, 84, 52-60.
Zhou, X., M. Liu, L. Huang, S. Mu, G. Shu, H. Wang, J. Zhang, W. Su, and S. Huo, 2025, Application of FWI technology for the detection of dam structural anomalies: A case study in Western China: Geophysics, 90, 1-17, https://doi.org/10.1190/geo2024-0930.1.
Available since 2000, SurfSeis is the product of many researchers and programmers at the Kansas Geological Survey (KGS).
The KGS is a research institute, and SurfSeis is a product of our research. Users can find documentation of our annual research advancements on the KGS website and in the published literature, and those new features are added to SurfSeis as they become available.
SurfSeis is a research and client proven software. It has been advancing and improving based on testing and peer-sanctioned advancements for more than 22 years. With KGS's decade-plus history of research and continuous improvement to this living software package, the facts as we know them and a number of researchers, programmers, and users have expressed to us, we are confident SurfSeis is the most advanced software for surface-wave seismic data analysis. We feel that we have no equal in the world from a technical or service perspective.
By purchasing SurfSeis customers support our further research.
For additional information, please check our "SurfSeis Features" Page.